
When someone asks you about the ROI of your last major technology initiative, you don’t want to give a number from the original business case, a number rebuilt by hand the week before, or a shrug, because none of them are a measurement. Technology ROI has to be proven, not assumed.
Gartner expects worldwide IT spending to reach $6.37 trillion in 2026, up 14.2% from 2025. AI faces the most pressure to show returns, but the same gap applies to ERP, data, cloud and every other category of tech investment.
Technology often creates value that nobody can prove. IBM found that 79% of executives see productivity gains from AI, but only 29% can confidently measure the ROI. Without a system to prove value, leaders fall back on instinct.
The ROI gap in numbers
Picture a quarterly portfolio review. The ERP upgrade is on schedule, the AI pilot’s usage is climbing, and the data platform went live last month. Then the CFO asks which of them paid for itself, and nobody can answer with a number they’d defend. Independent research suggests this is the norm:
- In PwC’s 29th Global CEO Survey of 4,454 CEOs, just 12% said AI had delivered both cost and revenue benefits, and more than half reported neither.
- In a Gartner survey of 506 CIOs and technology leaders published in October 2025, 72% said their organizations were breaking even or losing money on their AI investments.
- IBM’s 2025 CEO Study of 2,000 CEOs reported that only 25% of AI initiatives have delivered expected ROI and just 16% have scaled enterprise-wide.
Even the most-quoted statistic, MIT NANDA’s finding that 95% of organizations saw no measurable P&L return from generative AI, has been debated on methodology, which is what happens when nobody has a shared, auditable way to measure return.
How IT quantifies ROI today
In many enterprises, ROI gets calculated at a few fixed points, with little measurement in between.
1. ROI is projected once, then never revisited
ROI is calculated once, in a spreadsheet, to secure funding. The benefits are projections, often optimistic, and they are rarely revisited, even as scope changes along the way and the original value case no longer applies. Months later, that same projected figure gets reported as if it were the result. Once funding is approved, no one is held accountable for checking whether the benefits arrived.
2. Progress gets reported, value doesn’t
Once work starts, reporting shifts to what is easy to count: milestones hit, tickets closed, budget burned, go-live dates met. These show the project is progressing. They don’t tell you whether the business is better off. An initiative can be green on every status report while the value it was funded for shrinks. Even for AI, where the pressure to prove returns is highest, teams report on deployment and usage long before anyone checks whether the business outcome changed.
3. ROI is rebuilt by hand when someone asks
When the board or CFO asks what the money bought, someone rebuilds the answer by hand, pulling data from Jira, finance systems, spreadsheets, and people’s memories. The baseline is fuzzy, other initiatives have touched the same metric, and the final number is a negotiated estimate. Veolia’s technology organization is a good example. Before changing its approach, it ran a large technology portfolio with no single source of truth. Work was tracked through spreadsheets, email threads, and status decks rebuilt every week, and portfolio reviews were “prep-heavy and insight-light.” Leadership could see activity, but not decisions, risks or strategic alignment.
4. Instinct fills the gaps that data leaves
With no system connecting strategy, spend, and outcomes, leaders decide on experience and gut feel: which initiatives to fund, which to cut, which vendor delivered. People do this when the data isn’t there in time. In a March 2026 Harris Poll survey for OneStream of 352 CFOs, CIOs, CTOs and data leaders, 47% admitted making a material business decision in the past year based on inaccurate, incomplete or outdated financial data, and 61% said they second-guess their data at least once a month.
Assumed ROI vs. attributed ROI
The fix is a shift from ROI that is assumed (asserted after the fact) to ROI that is attributed (traced from a documented baseline to a realized dollar figure, with each step documented).
| Assumed ROI | Attributed ROI | |
| When it’s measured | Once, at funding approval; maybe again at year-end | Continuously, from intake through to realized value |
| Baseline | Implied or reconstructed later | Documented before a dollar is committed |
| What’s tracked | Activity: milestones, tickets, spend | Outcomes: cost avoided, revenue gained, risk reduced, hours released |
| Attribution | Full credit claimed; overlaps ignored | Contribution traced to the specific initiative, with overlaps shared |
| Cost view | Build cost only | Total cost of ownership, including change, run and people costs |
| Source of truth | Decks and spreadsheets rebuilt each cycle | One live data set used by the PM, CIO and CFO |
| How decisions get made | Experience and instinct | Evidence, with instinct applied to measured results |
| What happens next | Lessons lost when people move on | Every outcome informs the next funding decision |
A 5-step framework to quantify the ROI of tech initiatives
Step 1: Capture the baseline before you fund
As mentioned in our previous blog, “a benefit without a baseline is an opinion.” That applies to every kind of initiative, whether it is an AI pilot, an ERP upgrade or a CRM migration.
You cannot prove improvement without a starting point. Before approval, record the current state of every metric the initiative claims it will improve: cycle time, error rates, manual hours, cost per transaction, revenue leakage, incident volume. Timestamp it and lock it. This single step is the difference between “we think it helped” and “here is what changed.”
Step 2: Define value in business terms
Write the value hypothesis in the language of the CFO. “Deploy a new order management module” is an activity. “Reduce order errors from 3.2% to 1.5%, saving an estimated $300K a year” is a value case. Group benefits into four buckets so nothing gets double-counted:
| Value category | What it captures | Example metrics |
| Cost avoidance / reduction | Spend that no longer happens | Licenses retired, vendor spend, rework cost, cost per ticket |
| Revenue impact | New or protected revenue | Conversion, order value, revenue leakage recovered, time to market |
| Risk reduction | Exposure that shrinks | Incidents, audit findings, downtime hours, compliance penalties avoided |
| Capacity released | Time returned to higher-value work | Manual hours saved, cycle time, FTE capacity redeployed |
Treat “capacity released” carefully. Hours saved only become ROI when that capacity is redeployed or the avoided cost shows up in the budget. Otherwise, report it separately as productivity, not as dollars.
Step 3: Attribute value
Most metrics are touched by more than one initiative. If a data-quality program and a CRM rollout both claim the same drop in order errors, the enterprise has counted the same dollar twice. This is common, because new technology rarely goes live on its own. An AI rollout, for instance, usually arrives alongside efforts to improve data quality, reconfigure teams or streamline operations, which makes any single initiative’s contribution hard to isolate after the fact.
Attribution means agreeing up front how much of a shift each initiative can credibly claim, and keeping the reasoning visible. Practical methods include:
- Before/after against the locked baseline, adjusted for known external factors such as seasonality or volume.
- Phased or pilot comparisons, where one region, team or business unit goes live before another and acts as a control group.
- Contribution splits, agreed with finance, when several initiatives affect the same metric. The worked example below shows this in practice: a parallel pricing-data cleanup is credited with 20% of an error reduction, so the main initiative claims only the remaining 80%.
- A logged audit trail, so anyone can see what was decided, who decided it, and why an estimate was adjusted.
Step 4: Count the full cost, then track both sides continuously
ROI is only as accurate as its denominator. Use total cost of ownership: build, licenses, integration, internal people time, training and change management, and ongoing run costs. CFOs want to see what a tool will cost to run and maintain over its life, as well as what it costs to build.
Then track cost and realized value on the same cadence as delivery, not once a year. Set realistic timelines and agree on them with finance before launch, so each initiative is judged against the payback period it was funded on. Without continuous tracking, promising initiatives get killed early and weak ones survive on momentum.
Step 5: Close the loop
Feed realized outcomes back into how the next initiative is scoped, estimated and prioritized. Which types of initiative consistently beat their business case? Which vendors or delivery patterns underdeliver? Organizations that do this use the returns and lessons from one initiative to fund and shape the next. Over time, the portfolio gets smarter, and funding decisions rely on evidence rather than whoever tells the most confident story in the steering committee.
Worked example: assumed vs. attributed ROI on the same initiative
Consider a hypothetical order management modernization at a mid-sized manufacturer, processing 400,000 orders a year. The figures are illustrative, but the pattern is common.
The baseline (locked before funding): order error rate of 3.2% at an average cost of $45 per error ($576K a year), and 18,000 manual processing hours a year at a loaded cost of $40 an hour ($720K a year).
The results after go-live: errors fall to 1.4%, 9,000 manual hours are released and redeployed, and $150K a year of revenue leakage is recovered. A separate pricing-data cleanup ran at the same time, and finance agrees it drove about 20% of the error reduction.
| Assumed ROI | Attributed ROI | |
| Error reduction (per year) | $324K (full credit) | $259K (80% attributed) |
| Manual hours released (per year) | $360K | $360K |
| Revenue leakage recovered (per year) | $150K | $150K |
| 3-year benefit | $2.50M | $2.31M |
| 3-year cost | $1.50M (build and licenses only) | $1.80M (incl. change, training, run costs) |
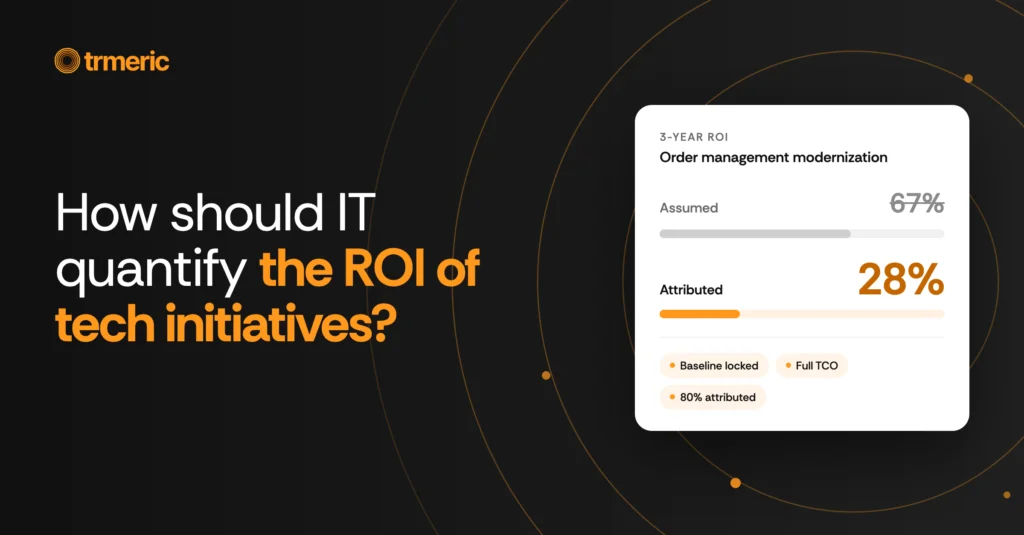
| 3-year ROI | 67% | 28% |
| Payback | ~1.8 years | ~2.3 years |
Both versions show a positive return. But the assumed number is more than twice the attributed one, and it is the assumed number that usually reaches the board. When the next initiative is benchmarked against it, the portfolio’s numbers drift further from reality. The attributed figure is smaller, but it survives a CFO’s scrutiny, and it tells you something true about what to fund next.
The formula used: ROI = (attributed benefit − total cost of ownership) ÷ total cost of ownership × 100.
How Trmeric helps IT quantify and prove ROI
Every step in the framework above can be done manually, but the trouble is that it depends on people keeping baselines, cost data, delivery signals, and outcome data connected across dozens of tools, for hundreds of initiatives, for years. That is exactly the work that falls apart under pressure, and it is why so many ROI figures end up assumed.
Trmeric is the agentic AI platform for enterprise transformation. It brings strategy, execution and measurable outcomes into one system, with AI agents working alongside teams from the first idea to realized value. It connects to the tools teams already use, such as Jira, GitHub and ERP systems, so ROI is built from live data rather than rebuilt by hand.
1. A value case and baseline from day one
When a business or IT team raises a new need, Trmeric’s agent turns the request into a scoped initiative with an effort estimate, risk flags and a business case that includes projected ROI. The value hypothesis and its starting metrics are recorded at intake, before any money is committed. Every initiative is mapped to a measurable business outcome, so there is always a baseline to measure against later. What used to take weeks of back-and-forth goes from idea to scoped, costed, and prioritized in minutes.
2. Funding decisions based on value
Trmeric runs transformation like an investment portfolio. Its agents rank every active initiative on business alignment, expected ROI and investment size, so high-impact work is funded on merit and weak bets are visible early. No dollar is committed until the value case is clear, replacing instinct-driven prioritization.
3. Attribution you can audit
Because strategy, delivery and outcome data are in one place, Trmeric can trace realized value back to the specific initiative that produced it. Estimates, overrides and adjustments are logged with the reasoning behind them, and people make every final decision. When the CFO asks where a number came from, the trail is already there.
4. Cost and value tracked continuously
Trmeric pulls signals from status updates, milestones, dependencies and the delivery tools teams already use. Its agents flag risks to schedule, spend and value before they become crises, and generate reports automatically. Realized value is tracked in real time on an initiative ROI view that shows return to date and adoption, so the board sees the actual return rather than a projection.
5. Every initiative makes the next one smarter
Trmeric builds an enterprise digital brain that remembers every decision, lesson and outcome. Over time it learns which kinds of initiative beat their business case and which fall short, and feeds that back into how new work is scoped, estimated and prioritized. Leaders still use judgment, now with evidence in front of them.
What changes for each role
- CIOs get one live view of the portfolio and a board-ready story of return that is backed by data.
- CFOs get ROI figures with a documented baseline, full cost and an attribution trail they can verify.
- PMOs and portfolio leads stop chasing status updates and rebuilding decks, because reporting is generated from live data.
- Project managers and delivery teams see how their work affects business outcomes.
Across Trmeric customers, more than $1 billion of transformation initiatives are now planned, delivered and measured on the platform. Explore how the platform works or see Trmeric in action.
The bottom line: prove the return
Technology budgets are growing faster than the ability to prove what they return. The organizations pulling ahead lock a baseline, attribute value carefully, count the full cost, and track all of it continuously in one place. When that system exists, instinct stops being a substitute for evidence and goes back to being what it should be: judgment applied to measured results.
FAQ
What is the formula for the ROI of an IT project?
The standard ROI formula is: ROI (%) = (Net benefit ÷ Cost of investment) × 100, where net benefit is the gain from the investment minus its cost.
For IT projects, two adjustments make the result more accurate:
ROI (%) = (Attributed benefit − Total cost of ownership) ÷ Total cost of ownership × 100
- Attributed benefit is only the share of value this initiative actually drove, measured against the baseline. If another project contributed to the same result, its share is taken out.
- Total cost of ownership (TCO) is the full cost of the initiative over its life, not just the purchase price. That means build, licenses, integration, internal people time, training, change management and ongoing run costs.
What is the difference between assumed and attributed ROI?
Assumed ROI is a figure asserted after the fact, usually copied from the business case. Attributed ROI is traced from a documented baseline to a realized outcome, with the reasoning and any shared credit between initiatives visible throughout.
How do you measure intangible benefits like productivity or better decisions?
Tie each one to a measurable proxy (hours released, cycle time, decision turnaround, error rates) and record the baseline. Only convert it to dollars when the capacity is redeployed or the cost is genuinely avoided; otherwise report it as a separate productivity metric.
Why do so many technology initiatives fail to show ROI?
Usually because nothing connected the initial value case to what was delivered, even when the technology worked. The organizations that capture value are the ones that redesign workflows around outcomes and track value systematically from the start.
How does Trmeric help measure the ROI of tech initiatives?
Trmeric captures a value case and baseline when each initiative is raised, prioritizes the portfolio by business alignment and expected ROI, and tracks cost and realized value in real time from the tools teams already use. The result is ROI that is attributed to specific initiatives with an audit trail, rather than assumed after the fact.
Who should own IT ROI measurement: the CIO or the CFO?
Both. The CIO owns delivery and the value case; the CFO owns the financial validation. Give both of them, and the PMO, the same live data set so there is nothing to reconcile.